Affinity diagram
Background
I planned and conducted a user testing with the product team to investigate user experience of an existing product on a kids website. We recruited 12 participants and I facilitated user tests with 6 participants. During the test, as a facilitator I asked question and took notes while an observer helped observe the facial expression and body language of the participants.
Analysis
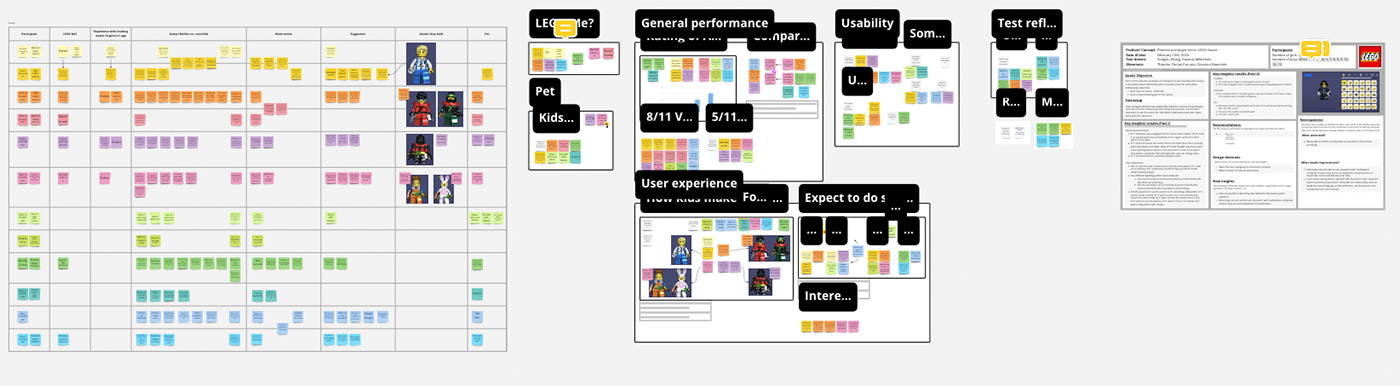
After the test, I gathered all the notes from both facilitators and observers and went through them by creating an affinity diagram in a Miro board.
I started by making a table of participants' demographic information and feedbacks based on the questions asked. Each post-it represented a feedback from the participants, and the post-its were colour coded based on the participants.

Then I used the affinity diagramming method to look at the post-its one by one without thinking of the questions and merged relevant post-its into groups. These groups were then merge into themes.

Contribution
I summarised the insights and recommendation into a one pager and shared with the product team. Based on this, the product team made decisions on improvement of the product.
